4 Feb 2020
Market Metrics: S&P/ASX200
- Posted by Dejan Pekic BCom DipFP CFP GAICD, Senior Financial Planner
Question, are current valuations stretched in the Australian stock market?
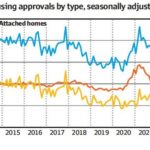
Attached is price to earnings chart (P/E ratio) to 31 December 2019 for the top 200 listed companies in Australia.
The price to earnings ratio is used as a measure of a company’s share price to its earnings per share. Generally a lower P/E is better because it implies that you are paying a lower price but as with all indicators this does not always hold true.
Comparing the P/E ratio over the past 14 years implies that the top 200 listed companies in Australia are stretch with the biggest trouble coming from the extreme valuation in the technology and healthcare sectors.
Click for chart.
The message for investors however is unchanged and that is to remain invested according to your appetite for volatility and when fear and panic take hold during the next financial catastrophe, to take advantage by buying more quality assets at discounted prices.
At Newealth we are always looking to support and promote our clients wherever possible and if you have any ideas or comments, please feel free to email me or to call me on +61 2 9267 2322.